Given all of the momentum that’s been building in the automation space, it’s clear that network automation is moving from the experimentation phase into mainstream adoption for many organizations. As with any technology, when this happens, leadership starts to focus on the business impact as they want to understand, in detail, how the technology is going to help them achieve their business objectives. Because of this, it’s critical for network teams to start thinking about how network automation will not just help them to do their jobs more effectively, but how automation will benefit their business.
To create what Itential considers to be the key metrics for network automation, our team looked at a wide variety of use cases and implementations, covering different business processes, technology domains, and industries. Based on that analysis, we arrived at these four metrics to help teams measure the impact and build their business case for network automation.
Metric #1: Workload Unit Cost
Workload unit cost focuses not only on the total cost of the automation system, but on the cost of that system in relation to how many activities it has completed, or will complete. The more activities your automation completes, the lower the workload unit cost.

When calculating your workload unit costs, it is recommended to look at the total costs associated with the automation system over a sufficient period of time – usually a three or five year view of the costs. You can then pro-rate those costs to do calculations for shorter time periods – such as a month, a quarter or a year.
Goal: To prioritize around solutions that will offer the lowest cost per unit of automation.
Metric #2: Efficiency/Productivity
This metric is primarily focused on the quantity of people involved in, and required to, perform any manual steps that still remains in your automation. To calculate this metric, you take the same number of activities that you used for the Workload Unit Cost metric and then divide that by the number of people that need to participate in any manual steps in the automations.

This metric highlights the differences between automation approaches that require a high level of manual activities versus those that can automate tasks by providing automated data collection, data manipulation, and data analysis. When you compare the efficiency/productivity metric for an automation that requires a high amount of manual effort to an automation that requires little-to-no manual effort, the benefits become obvious.
Goal: Maximize productivity by prioritizing for solutions that require the least manual intervention throughout the automation – meaning, the fewer people required to run the system, the better.
Metric #3: Time-to-Complete
Time-to-complete is focused on the total elapsed time for an activity to be completed – from the point when the activity is requested to the point when it is finished, including any idle time due to handoffs, delays, approvals, and scheduling.

Teams should evaluate solutions based on their ability to offer the lowest feasible time to complete, meaning prioritizing their selections on solutions that can automate the highest percentage of tasks in the activity and at the same time eliminate as much idle time as possible.
Goal: Prioritize platforms that can automate as much of the overall business process as possible to reduce the time-to-complete.
Metric #4: Versatility & Reach
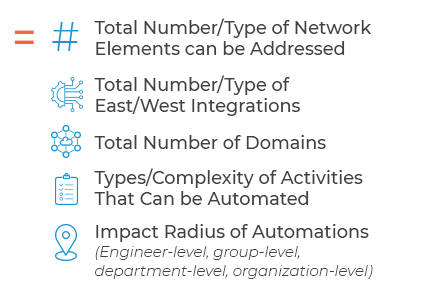
The fourth and final metric is versatility and reach. These refer to two different, but related concepts. By this, I mean they address similar questions – how flexible is the platform for automating different kinds of activities and how scalable is the solution to address high volumes of activities, devices, and domains?

While this math for this metric may not be as straightforward as the others, you’ll want to identify which of the items identified here that make sense within the context of your organization and business needs.
Goal: Prioritize solutions that provide high levels of versatility and the ability to integrate with your network, systems, and tools at scale.
How to Use These Metrics
In order to successfully communicate the business benefits of network automation with executive leadership, teams can utilize these metrics to:
- Drive their business justification to establish the model for measuring the impact of the automation solution.
- Set targets for existing and new automation initiatives.
- Create an executive dashboard to help keep executives informed of the successes of the automation system.
- Make more informed decisions about the direction for future automation initiatives.
Itential’s Automation Value Calculator
Since Itential’s inception, we’ve been working with our customers not only to deploy our platform, but also to develop their financial justifications for implementing network automation. It is a critical step for most teams, but can be challenging to quantify all of the components and to accurately project with precision what the benefits of automation will be. To help overcome this challenge, we’ve developed tools to assist teams in developing their business case.
Itential’s Automation Value Calculator helps teams to quickly determine the priority based on the calculated benefit for a variety of use cases. By inputting your organization’s data or using benchmark data developed from our customers’ network automation projects, you can get a clear picture of the immediate value automation can bring to your organization.
To get a more in depth look into the 4 key metrics discussed including real-life examples and analysis, watch Itential’s on-demand webinar, “Measuring & Maximizing the Business Impact of Network Automation.”


